seattle real estate stats

2025 Housing Market Reality Check: Still Tight, Still Expensive, Still Competitive

2025 Housing Market Reality Check: Still Tight, Still Expensive, Still Competitive

Let’s get one thing straight: 2025 did not turn into a buyer’s market. Anyone waiting for prices to fall or sellers to panic was mostly disappointed.

Yes, the market loosened a bit—but only a bit.

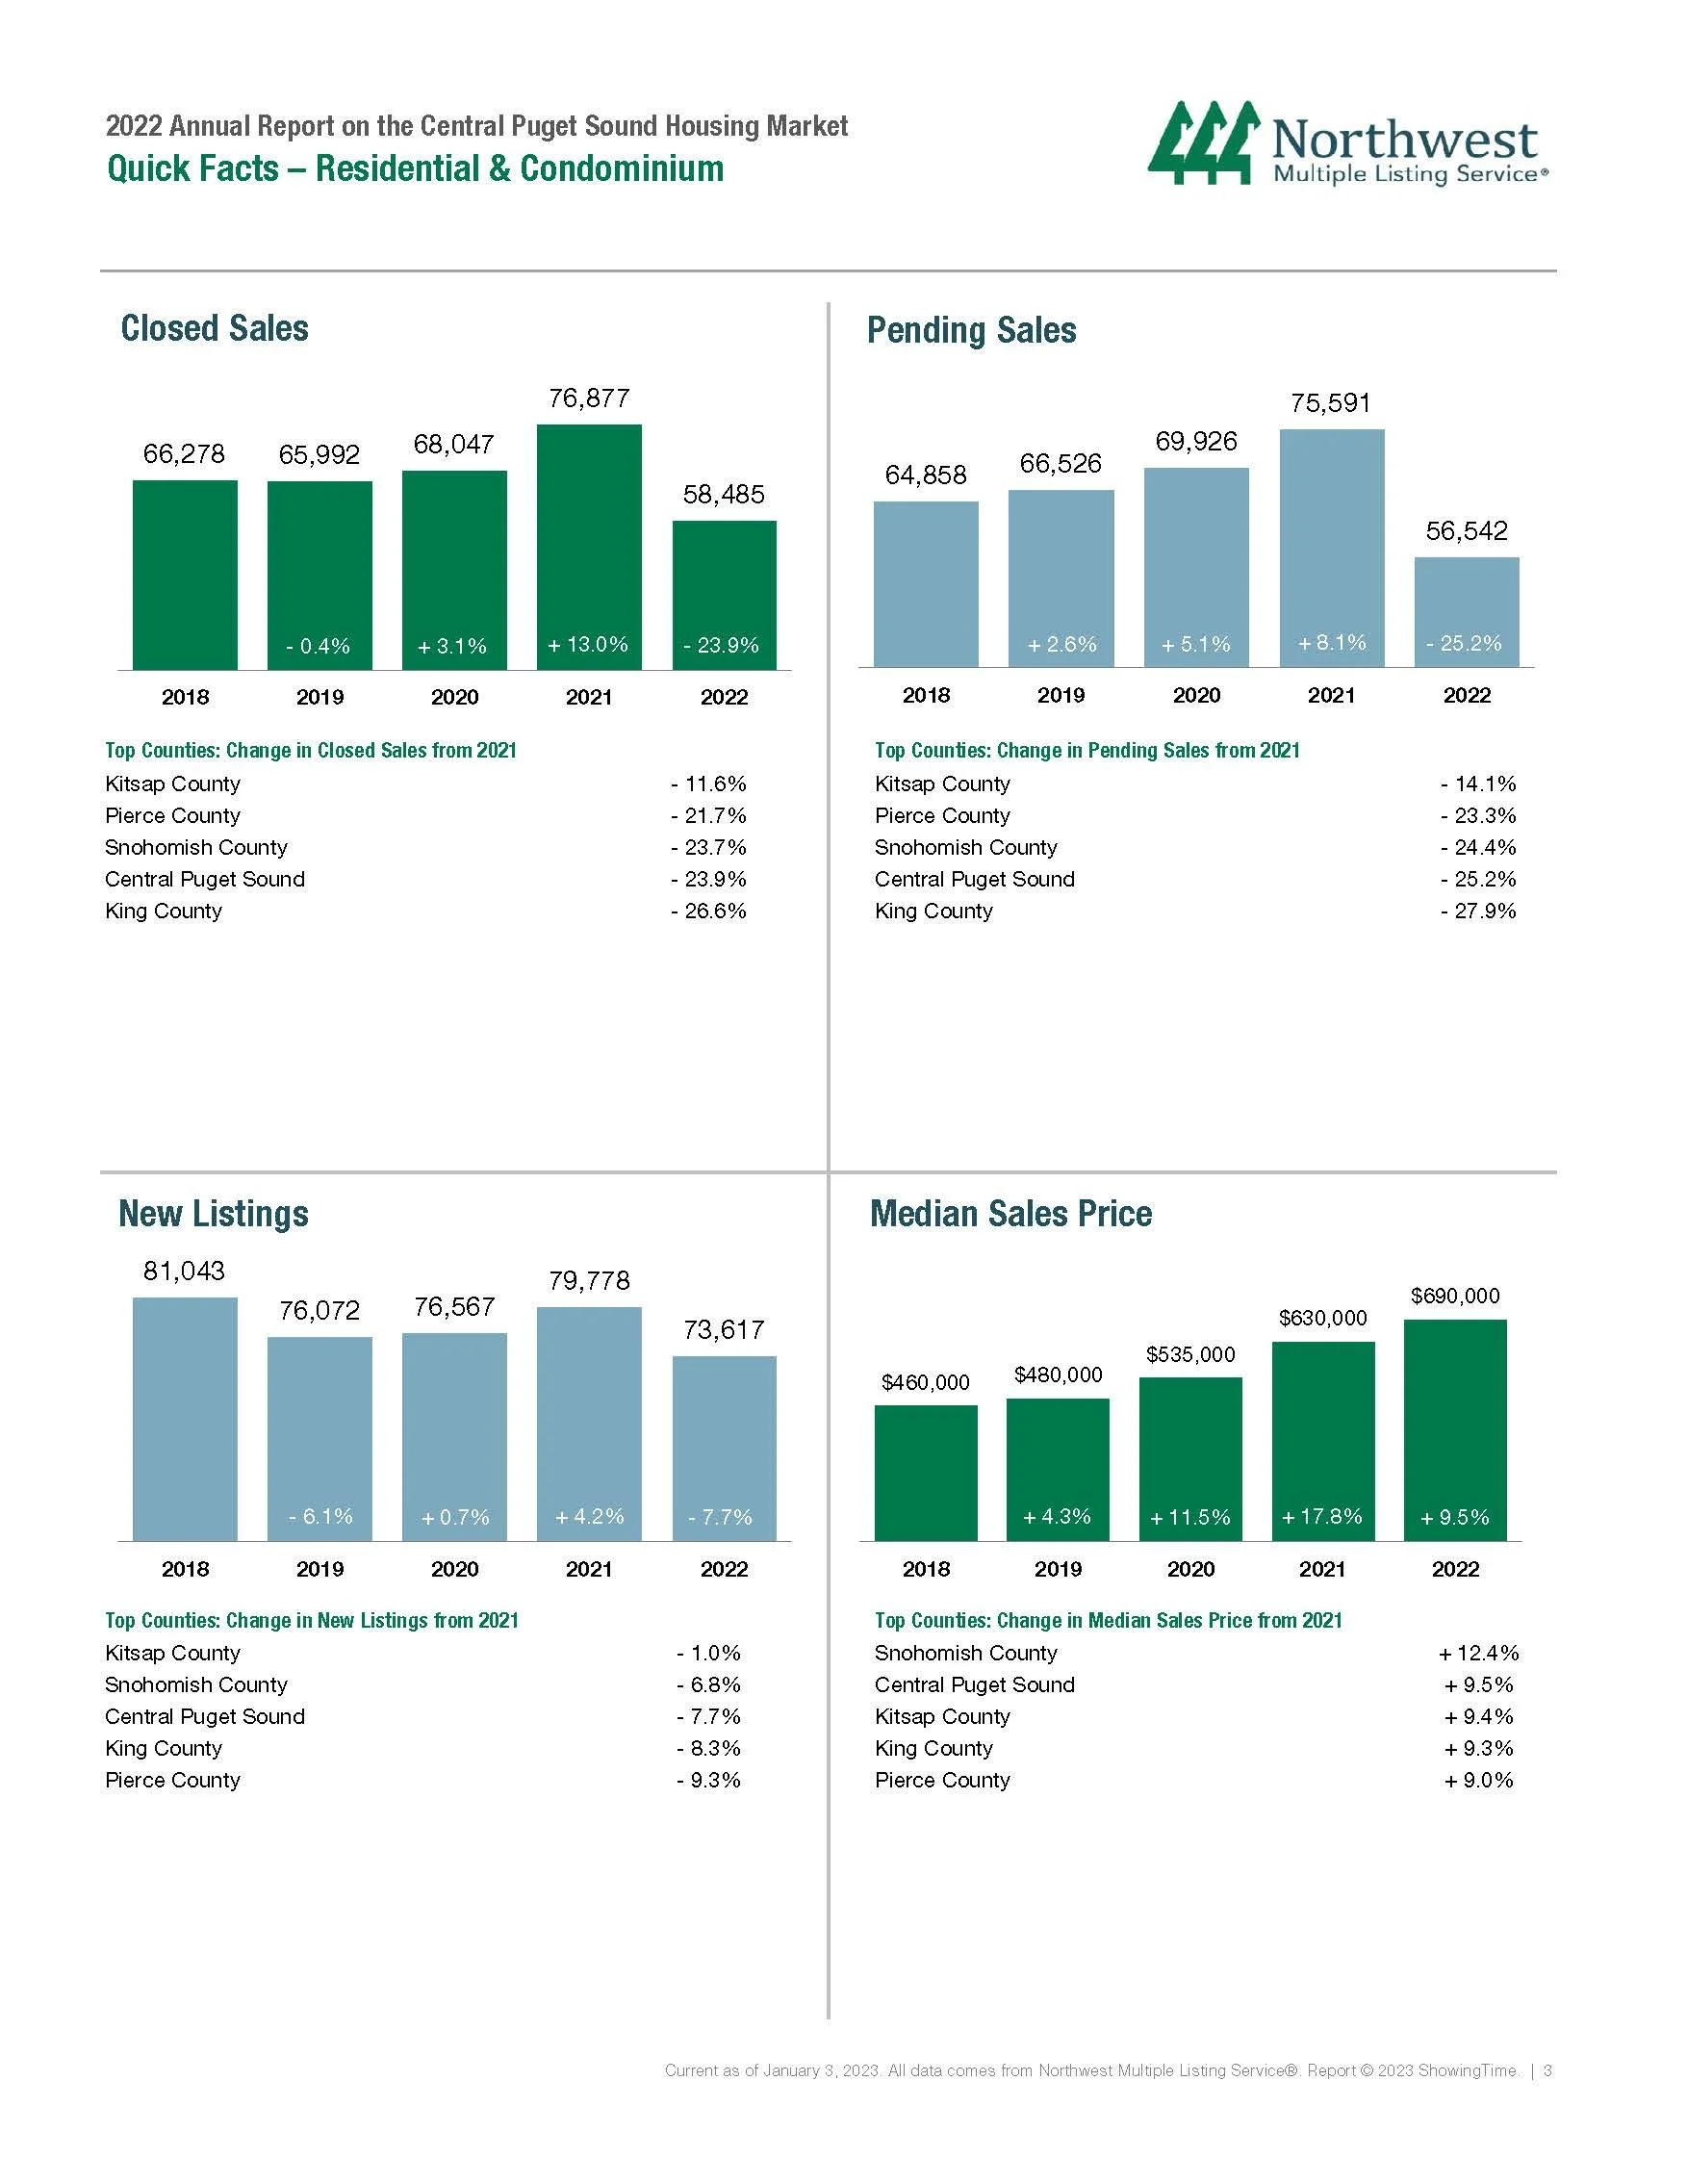
Sales held firm. Nearly 68,000 homes and condos closed across Northwest Washington, pushing more than $55 billion in sales volume. That’s basically flat from 2024, which tells you demand never went away—it just got more selective. Compare this to 107,000 homes sold in 2021!

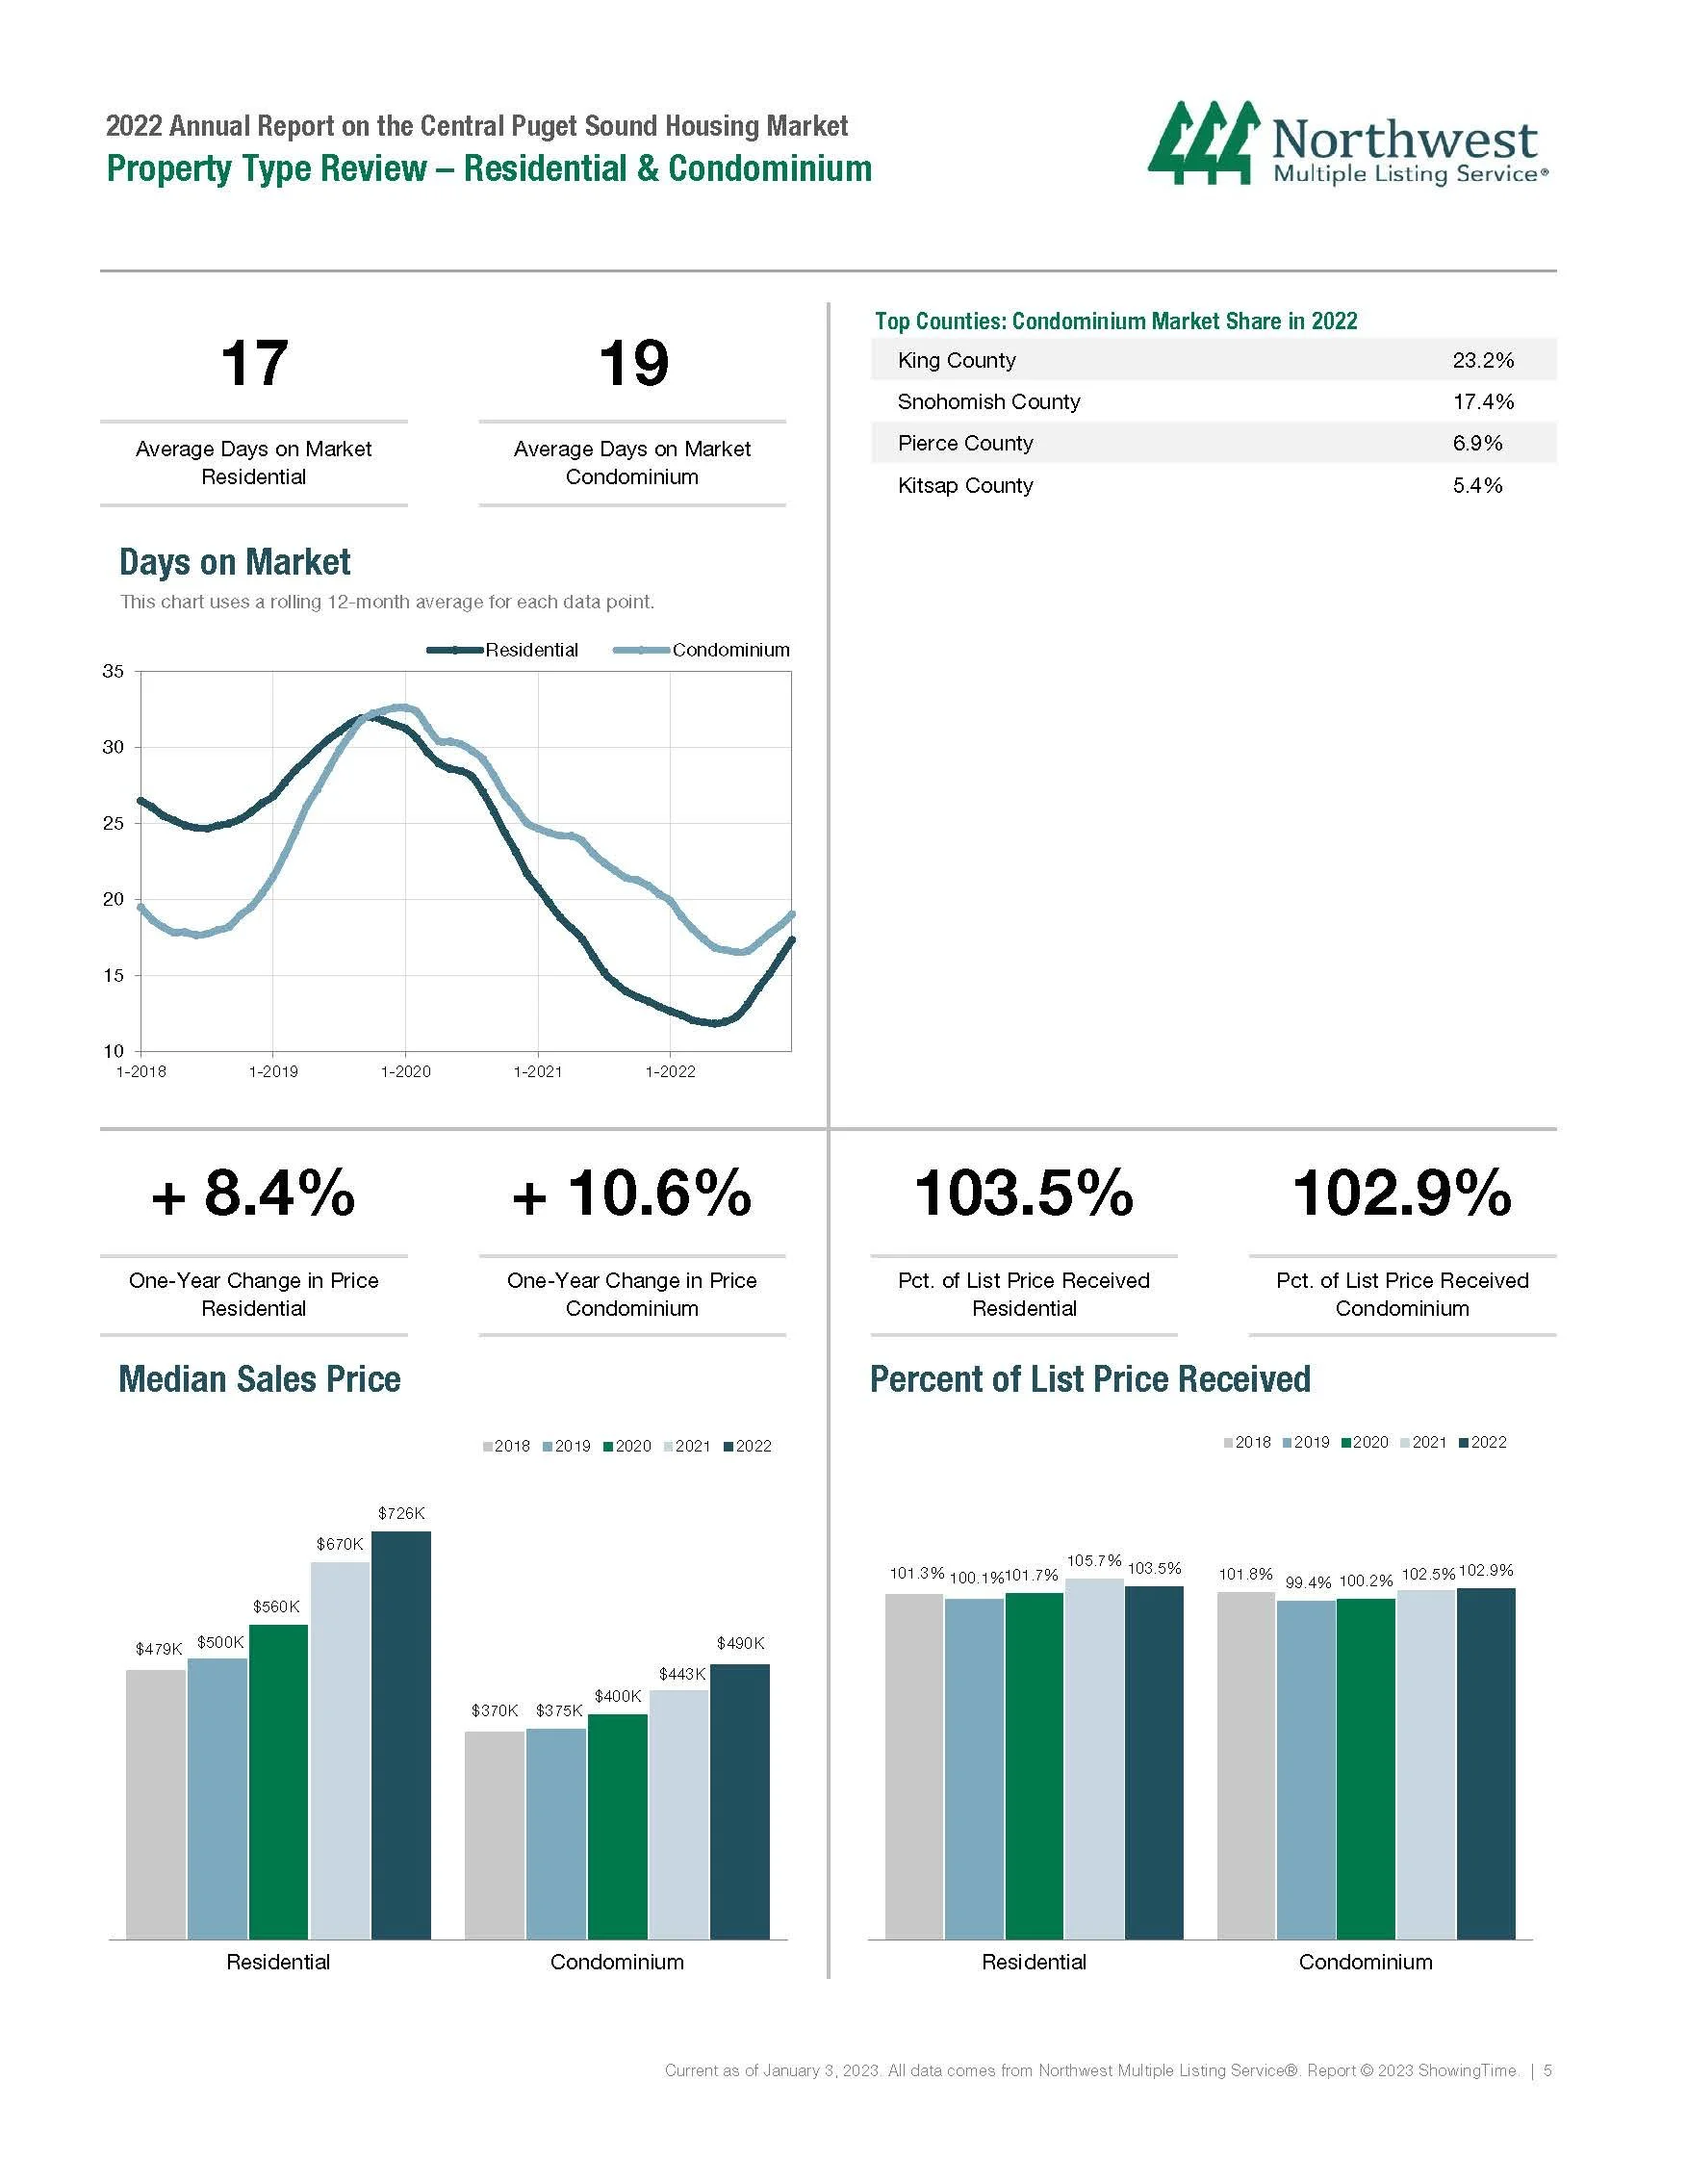
Prices refused to budge. The median price landed at $644,500, and in places like King County, single-family homes pushed close to $1 million. If you were expecting a meaningful price correction, it didn’t happen. Desirable areas stayed expensive, period.

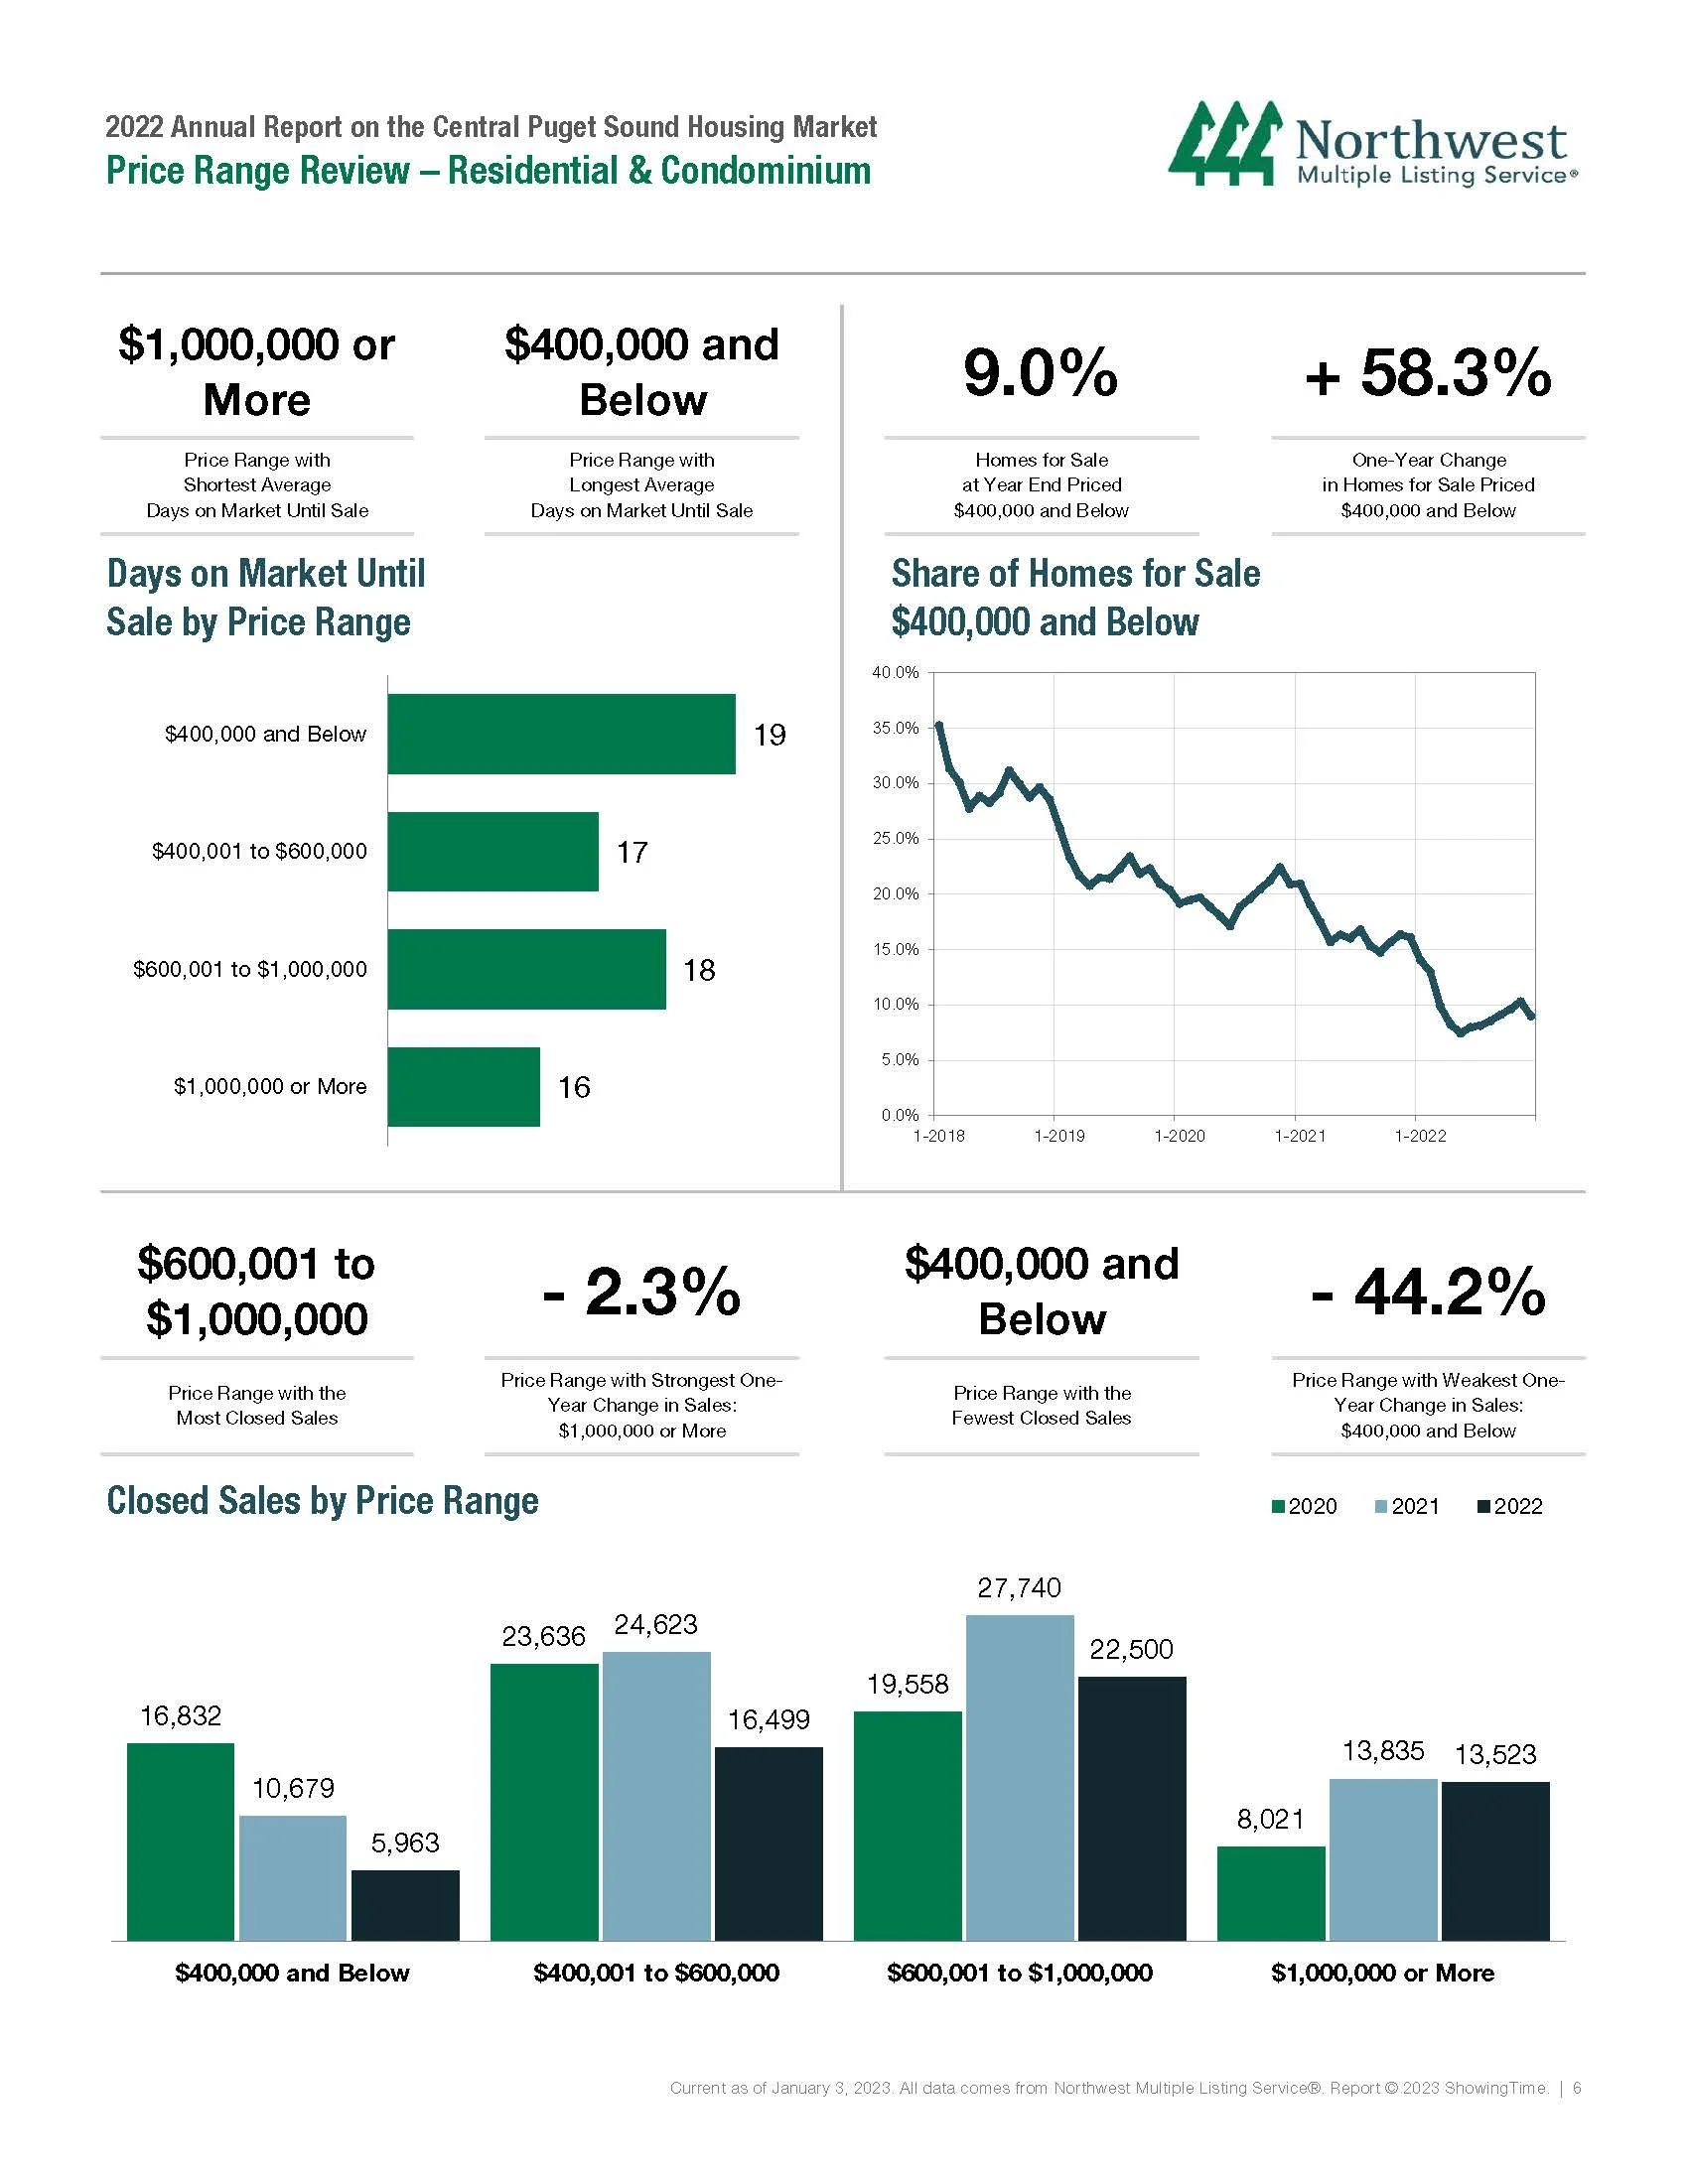
Inventory improved—but don’t get carried away. Listings were up and buyers finally had more than a handful of homes to choose from. That’s the good news. The bad news? We still averaged under three months of supply, which is nowhere near a balanced market. Sellers with well-priced, well-presented homes still had the upper hand.

Homes sold for almost full price. On average, sellers walked away with 99.6% of their asking price. Translation: buyers gained negotiating power at the margins, not leverage. Overpriced homes sat. Everything else sold.

Condos and new construction didn’t save affordability. Condos made up a small slice of sales, mostly in King County, and new construction came in at premium prices—$720K for new homes and $900K for new condos. That’s not relief; that’s just a different flavor of expensive.

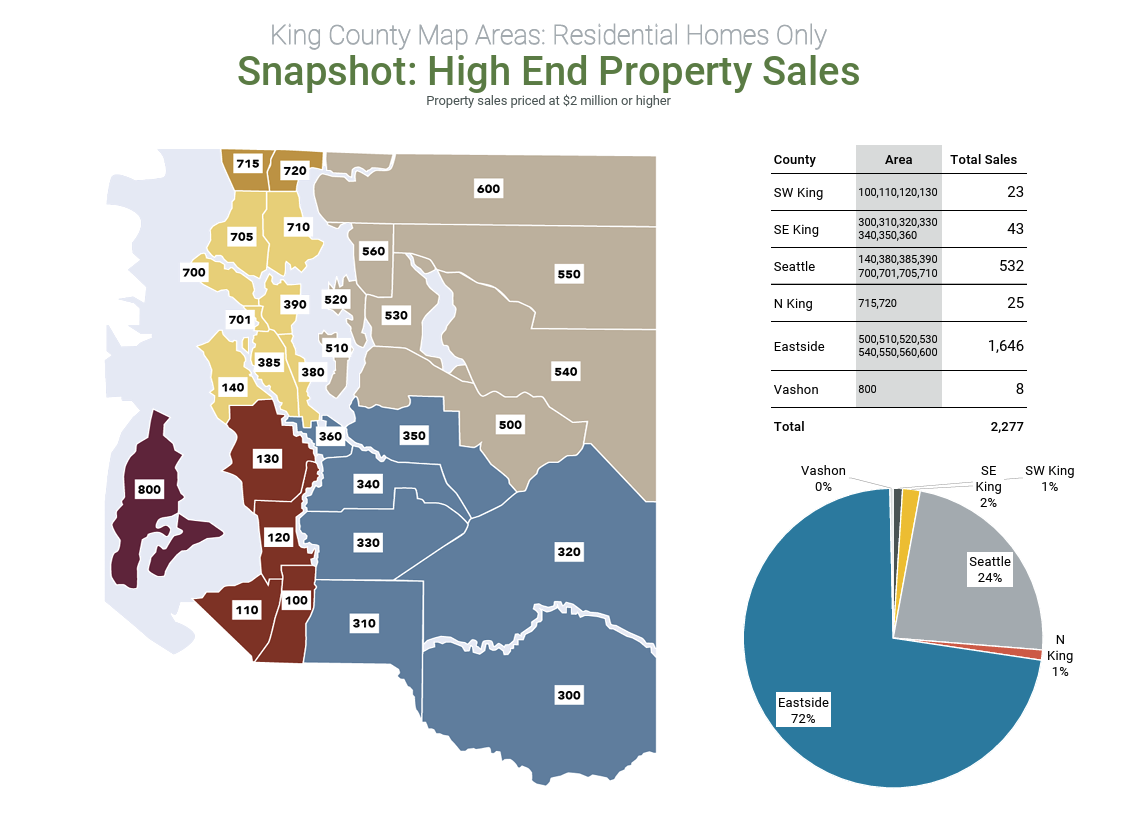
The luxury market didn’t flinch. Thousands of homes sold above $2 million, and million-dollar condos continued to move. High-net-worth buyers never left—they just became more patient and more demanding.

June had the highest sales price by nearly $20,000 compared to May in 2024.

The real takeaway

2025 rewarded realistic sellers and prepared buyers. The days of throwing a house on the market and naming your price are over—but so are the dreams of scoring a massive discount just for showing up.

This market wasn’t about timing—it was about pricing right, understanding micro-markets, and executing cleanly. And that’s exactly what will matter going forward.

Is The Spring Selling Season All It's Cracked Up to Be?

Yep. There is a spring selling season and it matters. In fact, the average increase in value from January to April from 2020 to 2024 was 15.9%! The average increase from May to December was -6.6% over the same period. While the average value increase from the whole year January to December is 7.9% for those 5 years. Therefore, there is certainly a spring frenzy. The 2nd & 3rd charts below tracks the last 3 years of the average price in King County. The price builds in the spring until we hit a summer lull and slides through the winter. Then rinse and repeat. In addition, often get a bump before school starts in the fall. Interested in your home value? Call me today to put my 25 years of real estate expertise to work!

Median Sales Price King County Single Family Residential

Value Change from Jan-Apri & May-Dec, Median SF Home (no condos) King County 2020-2024

Median Sales Price Chart in King County from 2022 through 2024:

$54 Billion! The 2024 Seattle Area Housing Highlights

Northwest MLS brokers logged 67,788 sales in 2024. Here are some of the highlights from last year and my thoughts on 2025. Those 67,788 sales were by the 32,000 brokers in the NWMLS totaling $54 billion in volume. from single family homes (SFH) and condominiums. 87% of the sales were single family homes with 13% condos. Over all, there were 5.58% more SFH & condos sold in 2024 than in 2023.

The median price for last year’s completed transactions (NWMLS wide in Western WA) was $640,000, an increase of 6.67% from 2023’s figure of $600,000. For comparison, the median price ten years ago in 2014 was $285,000. Both residential home and condominium median prices increased year-over-year, with residential homes increasing 5.60% from 2023, and condominiums increasing 7.52%. 23 of 26 counties in the NWMLS service area reported year-over-year price increases in 2024. The average list price to sales price was 100.2%. Inventory as measured by months of supply averaged 2.11 months overall for 2024, improving on 2023’s average of 1.79, but still well below the balanced market range of 4 to 6 months.

Homes selling for $1 million or more increased in 2024, registering 22.87% of sales compared to 18.3% in 2023. 15,508 properties were sold at $1 million or higher, including 1,714 that sold for over $2.5 million, a 29.2% increase from 2023’s 1,709. The highest-priced residential home sale was recorded in Mercer Island at $28.5 million.

When reviewing the highest home prices by school district, about half of the 14 most expensive districts were in King County. Mercer Island school district in King County showed the highest median sales price of $2,436,500, followed by Bellevue, Lake Washington, Issaquah, Northshore and Snoqualmie Valley school districts recording median sales prices over $1.1 million. Outside of King County, Bainbridge Island School District in Kitsap County showed the highest median sales price of $1.35 million, followed by Orcas Island ($1.055 million) in San Juan County and Conway in Skagit County ($1.02 million).

New construction accounted for about 14.2% of sales during 2024. The median price for all new construction was $739,950, up 5.71% from 2023’s figure of $700,000.

“The 30-year mortgage interest rate was actually higher at the end of 2024 (6.85%) than at the end of 2023 (6.61%),” said Steven Bourassa, director of the Washington Center for Real Estate Research (WCRER) at the University of Washington, in December 2024. “We may well be experiencing the pains of adjusting to a new normal, with persistent interest rates of 6% or higher.”

Historical value of single family homes in King, Snohomish and Pierce counties back to 1994.

King County: For single-family homes only, King County’s median was $950,000, up 8.48%, and Snohomish County was $790,000, up 7.12% from 2023. That compares to $660,000, up 5.6% for all counties.

There was a 27% increase in properties that sold over $1 million in the graphic below. The Eastside had the most with 4856 homes over $1M and Seattle was 2nd with 2650.

Residential home prices by school district in 2024.

2025 Outlook: With mortgage rates hovering around 7%, buyer demand will remain slow and steady. Inventory is climbing and prices should remain stable in 2025. Housing starts should increase due to new WA development laws and in city infill.

Source: NWMLS

December 2022 Puget Sound Real Estate Market Snapshot

How did we end the real in real estate? King County inventory is up 300% to 1.2 month from December 2021 creating better opportunities for buyers. Closed sales in the entire MLS declined by 23% from a record 2021 however, compared to 2018 through 2020 sales closed sales were off by 13%. Snohomish County had the biggest increase in average sales price by 15.5% while King County single family homes and condos increased by 8.9% year over year…

Year End Central Puget Sound Statistics. Click on the image to enlarge: